RETAIL
In 2011, Hong Kong retail shop sale and rental price progressively increased where the sale price raise was more than the rental.
The 2011 year end retail shop total supply amount was 10744200 in which 29% placed in Hong Kong Island, 41% in Kowloon, and 30% in the New Territories.
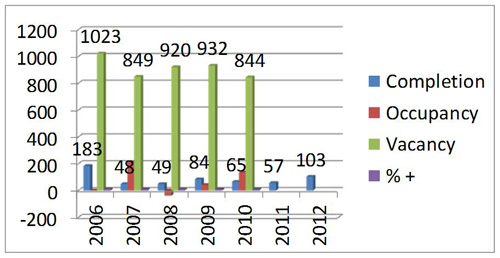
Retail Market Analysis Chart
|
2006 |
2007 |
2008 |
2009 |
2010 |
2011 |
2012 |
| Completion |
183 |
48 |
49 |
84 |
65 |
57 |
103# |
| Occupancy |
176 |
211 |
-39 |
42 |
135 |
|
|
| Vacancy |
1023 |
849 |
920 |
932 |
844 |
|
|
| % + |
9.8 |
8.1 |
8.7 |
8.7 |
7.9 |
|
|
︿:Occupancy figures are adjusted due to concerning factors
+:Year end vacancy in percentage from total supply
#:Predicted
Number
Units are in thousands square meters. |
Hong Kong Retail Market 2010 to 2012 Year by Year Comparison:
2010’s completions were 64600 square meters where around 66% in Kowloon, 37% in Yau Ma Tei, Tsim Sha Tsui and Mongkok area. This year’s occupancy increased to 134700 square meters, double the amount of completions during the year. Hence, vacancy amount decreased to 844300 square meters occupying the total supply’s 7.9%. Shopping mall units and upstairs shops take up 60% of total vacancy.
2011’s completion quantity was 56900 square meters but will significantly rise to 103100 square meters in 2012.
Within the 2011 new supply units, about 78% are from the South district, Yau Ma Tei, Tsim Sha Tsui, Mongkok and Sai Kung area. In 2012, about 45% completions will be in Kowloon and 30% in Hong Kong Island.
At the fourth quarter of 2011, retail sale price surged 28% and retail price incremented by 10% from a year ago.
|