RESIDENTIAL
According to statistics, Hong Kong residential market was prosperous in 2011. The Land Registry has 135,778 records of sale and purchase agreement; it is the highest ever throughout history. A property sales and purchase priced at more than HKD 10 million increased by 31% in a year. In addition to government policies to enhance market transparency, the Government also took the initiative to launch the sale of land during the year to have a total of 11 land auctions. Therefore, the market outlook is very positive.
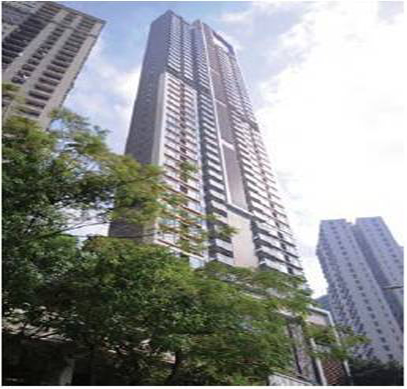
The number of Hong Kong private housing completion has been below 10,000 units for two consecutive years before the surge to about 13,410 units in 2011. 66% of these completions was in the New Territories, 26% in Kowloon and the remaining 8% in Hong Kong Island. By region, Yuen Long had the most new units, accounting for 27% of overall completions, followed by Shatin and Wong Tai Sin District, respectively accounted for 21% and 16% of the total completions.
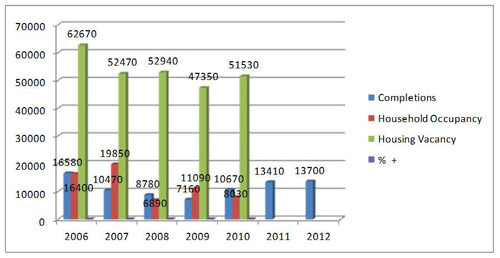
Private Residential Market Overall Analysis
|
2006 |
2007 |
2008 |
2009 |
2010 |
2011 |
2012 |
| Completions |
16580 |
10470 |
8780 |
7160 |
10670 |
13410# |
13700# |
| Household Occupancy |
16400 |
19850 |
6890 |
11090 |
8030 |
|
|
| Housing Vacancy |
62670 |
52470 |
52940 |
47350 |
51530 |
|
|
| % + |
5.9 |
4.9 |
4.9 |
4.3 |
4.7 |
|
|
+: Year end housing vacancy from total housing amount.
#: Predicted number |
There were 10,670 housing units completed in 2011. In 2012, the number will rise to 13,700 units in which about 75% in the New Territories and 14% from Kowloon. By region, Tseung Kwan O and Shatin will have 34% and 25% of new flats. In proportion to total new supply housing units, 2012 completions will take up 42%. By region, Yuen Long and Shatin will account for 22% and 14% from expected total new completions.
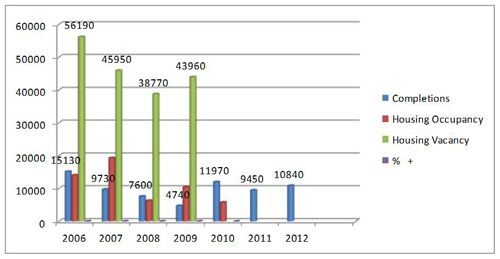
Private Residential (Middle/Small units) Analysis
|
2006 |
2007 |
2008 |
2009 |
2010 |
2011 |
2012 |
| Completions |
15130 |
9730 |
7600 |
4740 |
11970 |
9450# |
10840# |
| Housing Occupancy |
14040 |
19300 |
6290 |
10420 |
5790 |
|
|
| Housing Vacancy |
56190 |
45920 |
45950 |
38770 |
43960 |
|
|
| % + |
5.7 |
4.6 |
4.6 |
3.8 |
4.3 |
|
|
+:Year end housing vacancy from total housing amount
#:Predicted Number |
2010’s housing occupancy amount decreased by 44% to 5790 units in a year. Hence, that year end vacancy units increased to 43960.
2011 new housing completions were 9450 while 2012 will have 10840. These 2 years completions concentrated in the New Territories, but the proportion will decrease from 80% to 60%. These completions are more in the Tseung Kwan O and Yuen Long areas.
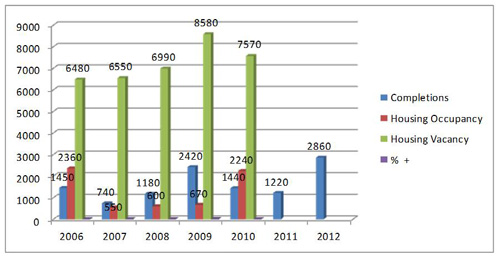
Private Residential (Big units) Analysis
|
2006 |
2007 |
2008 |
2009 |
2010 |
2011 |
2012 |
| Completions |
1450 |
740 |
1180 |
2420 |
1440 |
1220# |
2860# |
| Housing Occupancy |
2360 |
550 |
600 |
670 |
2240 |
|
|
| Housing Vacancy |
6480 |
6550 |
6990 |
8580 |
7570 |
|
|
| % + |
8.4 |
8.4 |
8.8 |
10.5 |
9.2 |
|
|
+:Year end housing vacancy from total housing amount
#:Predicted Number |
2010’s housing occupancy raised to 2240 units, which is far above the completions amount. Year end vacancy units thus decrease to 7570 units that is total housing amount’s 9.2%.
2011’s completions reduced to 1220 units while the figure will boost back to 2860 in 2012. 2011 new housing supply spread among Hong Kong Island, Kowloon and the New Territories while mainly concentrate in the New Territories in 2012.
Hong Kong 2011 second hang residential market continued the upward trend from 2010.,The overall sales price has been increased season by season. The sales price of the 2011 fourth quarter enlarged by 22% in a year. The rental market has been rising stably. 2011 fourth quarter’s rental price rose slightly slower but still a 17% from 2010.
|